Building a SOL Trading Bot with Python
Trading crypto manually is a losing game — at least for me. I kept second-guessing entries, panic-selling dips, and checking charts at 2 AM. So I did what any reasonable engineer would do: I automated the whole thing.
This post walks through the SOL/EUR trading bot I built and now run 24/7 on my home lab. It trades Solana on Kraken using a multi-indicator strategy, manages its own risk, and serves a live dashboard so I can keep an eye on it.
The stack
- Python 3.12 — the whole bot is pure Python
- CCXT — unified exchange API library, connected to Kraken
- pandas + pandas_ta — OHLCV data handling and technical indicator calculation
- FastAPI — lightweight web dashboard
- Docker Compose — two containers: the bot loop and the web UI
- Loguru — structured logging
Why SOL/EUR?
Before writing any code, I pulled 24-hour stats from Kraken across a bunch of EUR pairs to figure out what to trade. The criteria: enough volatility for the strategy to work, enough liquidity to not get killed on spreads.
Here’s what I found:
| Pair | ATR % (5m) | Daily range | 24h Volume (EUR) |
|---|---|---|---|
| SOL/EUR | 0.19% | 4.7% | ~€9M |
| ETH/EUR | 0.19% | 5.1% | ~€16M |
| BTC/EUR | 0.14% | 3.2% | ~€25M |
| AVAX/EUR | 0.22% | 8.1% | ~€500K |
| DOT/EUR | 0.20% | 8.5% | ~€300K |
| PEPE/EUR | 0.25% | 9.2% | ~€130K |
Pairs like AVAX, DOT, and PEPE look great on paper — big daily ranges, high ATR. But check their volumes: €130K–500K. That means wider bid/ask spreads, slippage on market orders, and potentially inflated volume numbers. The bot uses market orders, so on a thin order book you’d buy at worse prices and sell at worse prices. The volatility looks attractive but the spreads eat your edge.
SOL/EUR hits the sweet spot: tied for the highest ATR percentage, with €9M daily volume — enough for tight spreads and minimal slippage at my account size. The only real alternative is ETH/EUR (same ATR, nearly double the liquidity, slightly larger daily range), but at ~€1,871 per coin it’s a higher price point. That doesn’t technically matter since the bot trades in fractions, but SOL’s lower unit price makes the position sizing and mental math a bit more intuitive.
How it works
The bot runs on a simple 5-minute loop. Every tick it:
- Fetches the latest 5-minute and 1-hour OHLCV candles from Kraken
- Calculates technical indicators on both timeframes
- Evaluates buy/sell signals using a confluence strategy
- Checks risk limits before acting
- Executes trades (or holds) and updates the dashboard
The strategy: confluence of indicators
I didn’t want the bot to act on a single indicator — that’s how you get whipsawed. Instead, it requires at least 2 out of 4 indicators to agree before entering or exiting a position.
The indicators:
| Indicator | Buy signal | Sell signal |
|---|---|---|
| RSI (14) | RSI < 35 (oversold) | RSI > 65 (overbought) |
| MACD (12/26/9) | MACD crosses above signal | MACD crosses below signal |
| EMA (20/50) | EMA 20 > EMA 50 (bullish) | EMA 20 < EMA 50 (bearish) |
| Bollinger Bands (20, 2σ) | Price in bottom 20% of band | Price in top 20% of band |
On top of that, there are two filters that can block or gate trades:
- OBV (On-Balance Volume): buy signals are zeroed out if OBV is below its 20-period EMA — no volume confirmation, no entry
- Higher-timeframe trend filter: buys are only allowed when the 1-hour EMA 20 is above the 1-hour EMA 50 — this keeps the bot from buying into a macro downtrend
Here’s the core of the signal logic:
def get_signals(df):
    latest = df.iloc[-1]
    prev = df.iloc[-2]
    buy, sell = 0, 0

    # RSI
    if latest["rsi"] < 35:
        buy += 1
    elif latest["rsi"] > 65:
        sell += 1

    # MACD crossover
    if prev["macd"] <= prev["macd_signal"] and latest["macd"] > latest["macd_signal"]:
        buy += 1
    elif prev["macd"] >= prev["macd_signal"] and latest["macd"] < latest["macd_signal"]:
        sell += 1

    # EMA trend
    if latest["ema_short"] > latest["ema_long"]:
        buy += 1
    else:
        sell += 1

    # Bollinger Band position
    bb_pos = (latest["close"] - latest["bb_lower"]) / (latest["bb_upper"] - latest["bb_lower"])
    if bb_pos < 0.2:
        buy += 1
    elif bb_pos > 0.8:
        sell += 1

    # OBV gate — no volume, no buy
    if latest["obv"] <= latest["obv_ema"]:
        buy = 0

    return buy, sell
The strategy module then checks these counts against the minimum threshold (2) and applies the higher-timeframe filter before making a decision.
Risk management
This is where I spent most of the iteration time. A strategy that makes money is useless if one bad trade wipes you out.
ATR-based dynamic stops
Instead of fixed percentage stop-losses, the bot uses the Average True Range (ATR) to set stops that adapt to current volatility:
- Stop-loss: entry price − 2× ATR
- Trailing activation: entry price + 3× ATR
- Trailing distance: peak price − 1× ATR
When a trade is going well and hits the activation level, the bot switches from a hard stop-loss to a trailing stop that follows the price up. This lets winners run while still protecting profits.
Portfolio-level controls
Beyond individual trades, the risk manager enforces two hard limits:
- Daily loss limit (5%): if the portfolio drops 5% from the start-of-day balance, the bot pauses trading until the next day
- Max drawdown (15%): if the portfolio drops 15% from its all-time peak, the bot halts completely and requires manual intervention
These are non-negotiable circuit breakers. The bot can’t talk itself out of them.
class RiskManager:
    def check(self, current_balance):
        # Daily loss check
        daily_loss = (self.daily_start_balance - current_balance) / self.daily_start_balance
        if daily_loss >= 0.05:
            return False, "Daily loss limit hit"

        # Max drawdown check
        drawdown = (self.peak_balance - current_balance) / self.peak_balance
        if drawdown >= 0.15:
            self.halted = True
            return False, "Max drawdown hit"

        return True, "OK"
The dashboard
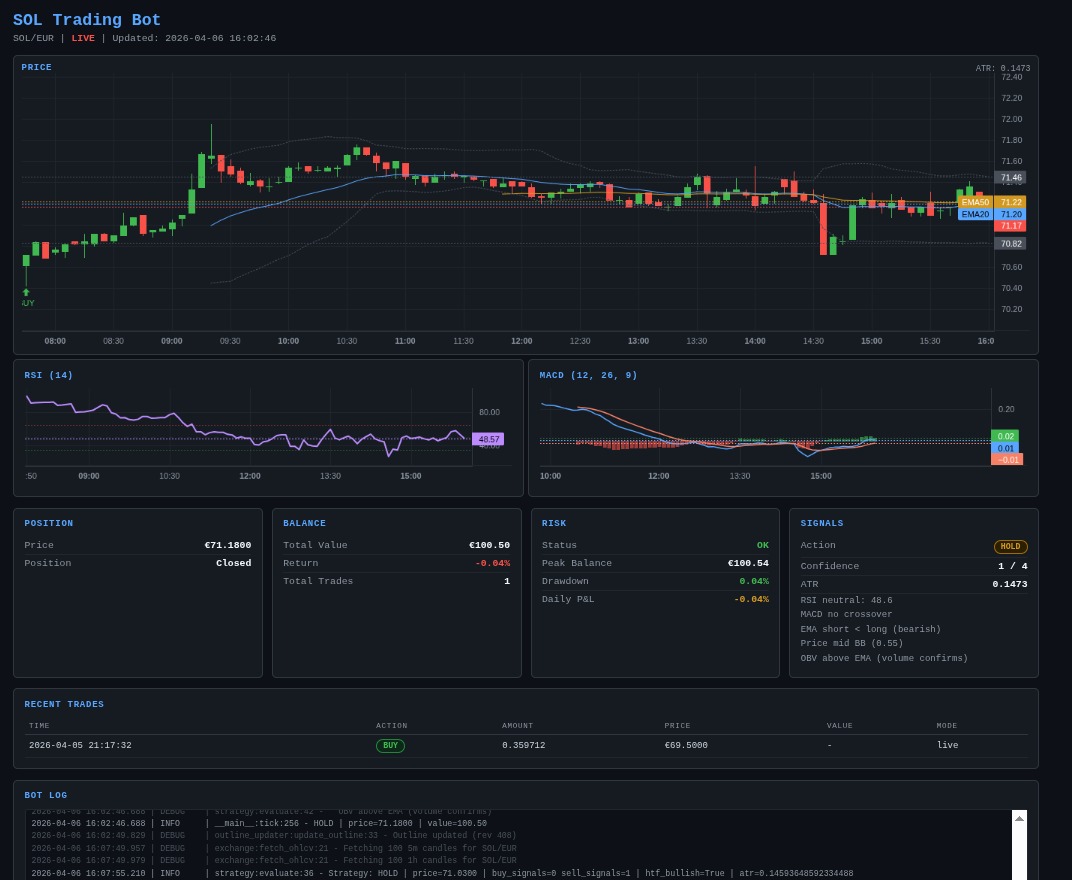
The bot writes its state to a JSON file on every tick. A separate FastAPI container serves a web dashboard that reads this state and renders:
- Current price and position status
- Entry price, stop-loss, and take-profit levels
- Portfolio balance breakdown (EUR + SOL)
- Risk status (daily loss, drawdown from peak)
- Trade history log
- OHLCV chart with indicator overlays
Both containers share a data/ volume, so the dashboard always shows the latest state without any direct coupling between the bot and the web server.
Deployment
The whole thing runs in Docker Compose — two services, one build:
services:
  bot:
    build: .
    container_name: trading-bot
    restart: unless-stopped
    env_file: .env
    volumes:
      - ./data:/app/data
    command: python3 bot.py

  web:
    build: .
    container_name: trading-web
    restart: unless-stopped
    ports:
      - "8501:8501"
    volumes:
      - ./data:/app/data
    command: uvicorn web:app --host 0.0.0.0 --port 8501
API keys live in a .env file. The bot supports both paper trading and live mode — flip TRADING_MODE=live when you’re ready to go real.
What I learned
- Confluence beats conviction. Single-indicator strategies get chopped up. Requiring multiple signals to agree filters out a lot of noise.
- Volume matters. Adding OBV as a gate for buy signals was one of the biggest improvements. No point buying if there’s no volume behind the move.
- ATR > fixed percentages. A 3% stop-loss means very different things in low-volatility vs. high-volatility markets. ATR-based stops adapt automatically.
- The higher-timeframe filter is worth it. Checking the 1-hour trend before entering on 5-minute signals cut out a lot of counter-trend losses.
- Risk management is the strategy. The actual indicator logic is maybe 30% of the code. The rest is position sizing, stop management, and circuit breakers.
- Liquidity trumps volatility. Picking a pair with tight spreads matters more than chasing the biggest daily range. The edge comes from the strategy, not from hoping for wild swings.
What’s next
The bot is running live with a small amount of capital. I’m watching it, collecting data, and thinking about:
- Adding more pairs beyond SOL/EUR
- Backtesting parameter variations more systematically
- Integrating notifications (Telegram/Discord) for trades and risk events
- Exploring ML-based signal weighting instead of equal-weight confluence
For now, it’s doing its thing — quietly trading every 5 minutes while I do literally anything else. Which was the whole point.